Observability 功能
概述
tRPC-Agent-Go 框架内置了全面的可观测(Observability)功能,基于 OpenTelemetry 标准协议,为 Agent 应用提供了强大的可观测性能力。
通过可观测功能,开发者可以实现对 Agent 运行状态的全方位监控,包括链路追踪、性能指标收集和日志记录等。
🎯 核心特性
链路追踪(Tracing) :完整记录 Agent 执行过程中的调用链路性能指标(Metrics) :收集 Agent 运行时的关键性能数据日志聚合(Logging) :统一的日志收集和管理多平台支持 :支持 Jaeger、Prometheus、Galileo、智研监控宝 等主流监控平台灵活配置 :支持多种配置方式和自定义扩展
与不同的监控平台集成
Langfuse 集成
Langfuse 是专为 LLM 应用设计的可观测平台,支持通过 OpenTelemetry 协议采集链路追踪数据。tRPC-Agent-Go 可通过 OpenTelemetry 协议将 Trace 数据导出到 Langfuse。
1. 部署 Langfuse
可参考 Langfuse 官方自托管指南 进行本地或云端部署。快速体验可参考 Docker Compose 部署文档 。
2. Go 编写接入代码
export LANGFUSE_PUBLIC_KEY = "your-public-key"
export LANGFUSE_SECRET_KEY = "your-secret-key"
export LANGFUSE_HOST = "your-langfuse-host" # 以 host:port 形式填写(不带 http:// 协议头),例如 "cloud.langfuse.com:443" 或 "localhost:3000".
export LANGFUSE_INSECURE = "true" # 用于不安全连接(仅限开发环境)
import (
"context"
"log"
"trpc.group/trpc-go/trpc-agent-go/telemetry/langfuse"
)
func main () {
// Start trace with Langfuse integration using environment variables
clean , err := langfuse . Start ( context . Background ())
if err != nil {
log . Fatalf ( "Failed to start trace telemetry: %v" , err )
}
defer func () {
if err := clean ( context . Background ()); err != nil {
log . Printf ( "Failed to clean up trace telemetry: %v" , err )
}
}()
完整示例可参考 examples/telemetry/langfuse 。
注意:LANGFUSE_HOST 会直接传给 OpenTelemetry 的 otlptracehttp.WithEndpoint,因此不能包含 http:// 或 https://。协议由 LANGFUSE_INSECURE 控制,路径固定为 /api/public/otel/v1/traces。
运行示例:
你可以在 Langfuse 控制台查看链路追踪数据。
消息 payload 的兼容策略以及推荐使用的 OTel role + parts 字段,见 多模态遥测消息 。
接入代码说明
Langfuse 支持通过 /api/public/otel (OTLP) 接口接收 Trace 数据,仅支持 HTTP/protobuf,不支持 gRPC。
上述代码通过设置 OTEL_EXPORTER_OTLP_HEADERS 和 OTEL_EXPORTER_OTLP_TRACES_ENDPOINT 来接入 langfuse。
# 欧盟数据区
OTEL_EXPORTER_OTLP_ENDPOINT = "https://cloud.langfuse.com/api/public/otel"
# 美国数据区
# OTEL_EXPORTER_OTLP_ENDPOINT="https://us.cloud.langfuse.com/api/public/otel"
# 本地部署 (>= v3.22.0)
# OTEL_EXPORTER_OTLP_ENDPOINT="http://localhost:3000/api/public/otel"
# 设置 Basic Auth 认证
OTEL_EXPORTER_OTLP_HEADERS = "Authorization=Basic ${ AUTH_STRING } "
其中 AUTH_STRING 为 base64 编码的 public_key:secret_key,可用如下命令生成:
echo -n "pk-lf-xxxx:sk-lf-xxxx" | base64
# GNU 系统可加 -w 0 防止换行
如需单独指定 trace 数据的 endpoint,可设置:
OTEL_EXPORTER_OTLP_TRACES_ENDPOINT = "http://localhost:3000/api/public/otel/v1/traces"
Jaeger、Prometheus 等开源监控平台
可以参考 examples/telemetry 的代码示例。
package main
import (
"context"
"log"
ametric "trpc.group/trpc-go/trpc-agent-go/telemetry/metric"
atrace "trpc.group/trpc-go/trpc-agent-go/telemetry/trace"
)
func main () {
// 启动指标收集
mp , err := ametric . NewMeterProvider (
context . Background (),
ametric . WithEndpoint ( "localhost:4318" ),
ametric . WithProtocol ( "http" ),
)
if err != nil {
log . Fatalf ( "Failed to create meter provider: %v" , err )
}
defer mp . Shutdown ( context . Background ())
ametric . InitMeterProvider ( mp )
// 启动链路追踪
traceClean , err := atrace . Start (
context . Background (),
atrace . WithEndpoint ( "localhost:4317" ), // trace 导出地址
)
if err != nil {
log . Fatalf ( "Failed to start trace telemetry: %v" , err )
}
defer traceClean ()
// 你的 Agent 应用代码
// ...
// 可以添加自定义 trace 和 metrics
}
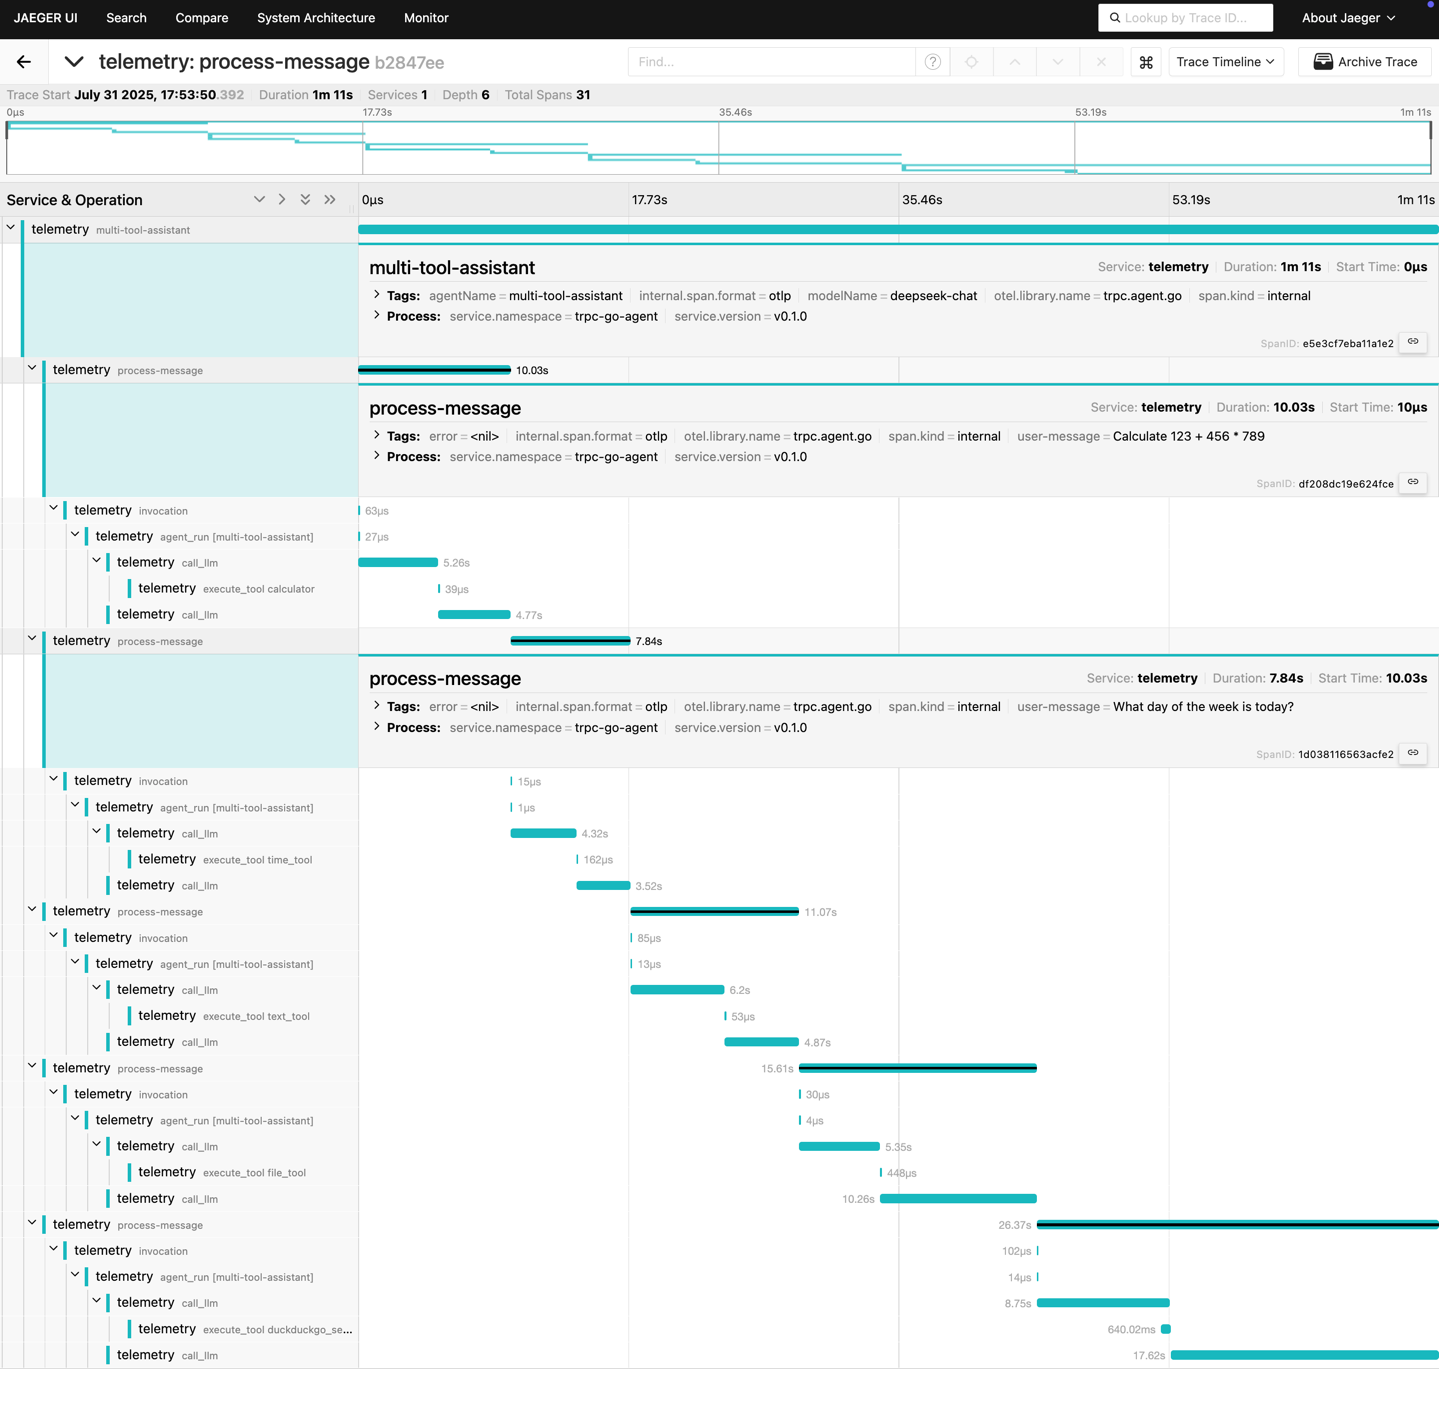
Jaeger trace 示例
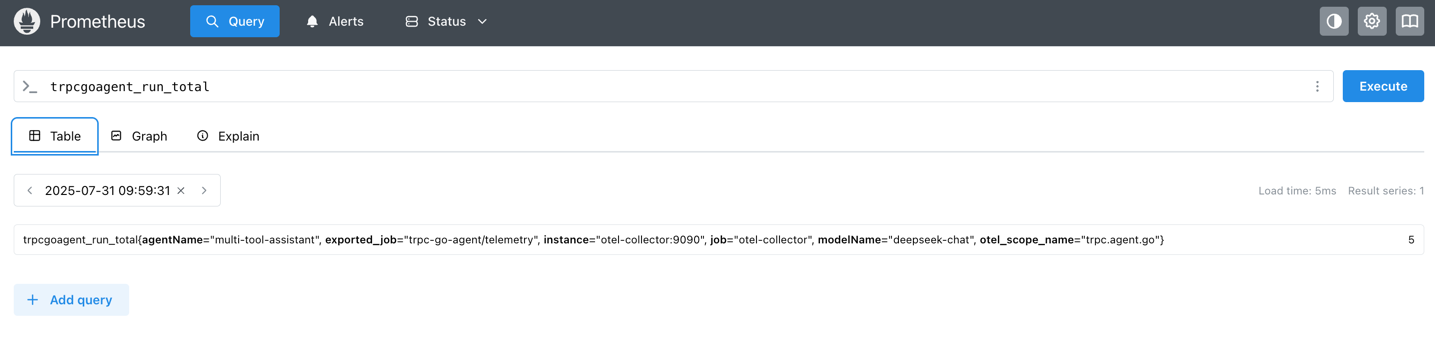
Prometheus 监控指标示例
实际应用示例
基本的指标和追踪
package main
import (
"context"
"fmt"
"time"
ametric "trpc.group/trpc-go/trpc-agent-go/telemetry/metric"
atrace "trpc.group/trpc-go/trpc-agent-go/telemetry/trace"
"trpc.group/trpc-go/trpc-agent-go/log"
"go.opentelemetry.io/otel/attribute"
"go.opentelemetry.io/otel/metric"
"go.opentelemetry.io/otel/trace"
)
func main () {
// 启动指标收集
mp , err := ametric . NewMeterProvider (
context . Background (),
ametric . WithEndpoint ( "localhost:4318" ),
ametric . WithProtocol ( "http" ),
)
if err != nil {
log . Fatalf ( "Failed to create meter provider: %v" , err )
}
defer mp . Shutdown ( context . Background ())
ametric . InitMeterProvider ( mp )
meter := mp . Meter ( "trpc_agent_go.app" )
if err := processAgentRequest ( context . Background (), meter ); err != nil {
log . Errorf ( "processAgentRequest failed: %v" , err )
}
}
func processAgentRequest ( ctx context . Context , meter metric . Meter ) error {
// 创建追踪 span
ctx , span := atrace . Tracer . Start (
ctx ,
"process-agent-request" ,
trace . WithAttributes (
attribute . String ( "agent.type" , "chat" ),
attribute . String ( "user.id" , "user123" ),
),
)
defer span . End ()
// 创建指标计数器
requestCounter , err := meter . Int64Counter (
"agent.requests.total" ,
metric . WithDescription ( "Total number of agent requests" ),
)
if err != nil {
return err
}
// 记录请求
requestCounter . Add ( ctx , 1 , metric . WithAttributes (
attribute . String ( "agent.type" , "chat" ),
attribute . String ( "status" , "success" ),
))
// 模拟处理过程
time . Sleep ( 100 * time . Millisecond )
return nil
}
Agent 执行追踪
框架会自动为 Agent 的关键组件添加监控埋点:
// Agent 执行会自动生成以下监控数据:
//
// Traces:
// - agent.execution: Agent 整体执行过程
// - tool.invocation: Tool 调用过程
// - model.api_call: 模型 API 调用过程
监控数据分析
链路追踪分析
典型的 Agent 执行链路结构:
通过链路追踪可以分析:
性能瓶颈 :识别耗时最长的操作错误定位 :快速找到失败的具体环节依赖关系 :了解组件间的调用关系并发分析 :观察并发执行的效果
Graph LLM 节点收到错误响应时,会同时记录到 chat span 和 chat 指标。
两个通道都根据 model callback 处理后的响应生成 error.type:先使用响应中的错误类型作为基础标签,
类型为空时使用 _OTHER;再在错误码非空时追加 _ 和错误码。
例如,类型为空、错误码为 429 时,最终标签为 _OTHER_429。
chat span 会标记为错误;父级 workflow span 也可能记录向上传播的失败。
最终响应校验失败时,也会在 chat span 上记录与 chat 指标一致的 error.type,
包括 model callback 已提供成功的替换响应、但后续最终校验仍失败的情况。
Span Attribute 策略(生产侧)
telemetry/trace 提供 opt-in 的 SpanAttributePolicy,在 span 创建阶段控制大 payload span attribute 的采集与写入大小。
默认不配置时行为不变。
能力
Drop() 与无条件 Omit()(未配 MaxBytes)可避免 json.Marshal。MaxBytes() + Omit():[]byte 路径(如 execute_tool 的 tool arguments)按长度判断,无需额外 marshal;JSON 路径(chat / workflow / invoke_agent)仍需完整 marshal,不能 降低堆峰值。Truncate() 始终完整 marshal,仅限制写入 span 的值大小。
规则
能否降低 marshal 堆峰值
说明
Drop()是
跳过序列化,不写 attribute
Omit()(无 MaxBytes)是
跳过 payload 序列化
MaxBytes(n) + Omit()JSON:否;[]byte:是
JSON 路径需完整 marshal 后再比阈值;[]byte 路径仅 len 判断
Truncate(n)否
完整序列化后截断导出
想降内存,优先 Drop() 当前后端不会读取 的 attribute。不要把某一套示例当成通用配置:Langfuse 与 Jaeger / 通用 OTLP 读的 key 不同。
覆盖范围
已接入 chat、invoke_agent、workflow、execute_tool 的大 payload attribute(messages、llm request/response、workflow request/response、tool arguments/result 等)。
配置入口
import atrace "trpc.group/trpc-go/trpc-agent-go/telemetry/trace"
// Langfuse:保留 *.otel(含 multimodal parts)。可 Drop 废弃的 legacy messages。
// chat/generation span 上不要把 .otel、legacy messages 和 llm_request/llm_response 全部 Drop,否则 Input/Output 可能为空。
clean , err := atrace . Start ( ctx ,
atrace . WithSpanAttributePolicy (
atrace . WithAttributeRule ( atrace . OperationChat , atrace . AttrInputMessages , atrace . Drop ()),
atrace . WithAttributeRule ( atrace . OperationChat , atrace . AttrOutputMessages , atrace . Drop ()),
atrace . WithAttributeRule ( atrace . OperationInvokeAgent , atrace . AttrInputMessages , atrace . Drop ()),
atrace . WithAttributeRule ( atrace . OperationInvokeAgent , atrace . AttrOutputMessages , atrace . Drop ()),
),
)
Jaeger / Galileo / 通用 OTLP 消费的是原始 span attribute。若 UI 只认 gen_ai.input.messages / gen_ai.output.messages,可以 Drop *.otel 以降低 marshal 成本:
clean , err := atrace . Start ( ctx ,
atrace . WithSpanAttributePolicy (
atrace . WithAttributeRule ( atrace . OperationChat , atrace . AttrInputMessagesOTel , atrace . Drop ()),
atrace . WithAttributeRule ( atrace . OperationChat , atrace . AttrOutputMessagesOTel , atrace . Drop ()),
atrace . WithAttributeRule ( atrace . OperationInvokeAgent , atrace . AttrInputMessagesOTel , atrace . Drop ()),
atrace . WithAttributeRule ( atrace . OperationInvokeAgent , atrace . AttrOutputMessagesOTel , atrace . Drop ()),
),
)
未调用 trace.Start 时,可在首次 LLM 调用前使用 atrace.SetSpanAttributePolicy(...)。trace.Start 在 tracer 初始化成功 后安装 policy,clean() 会恢复之前的 policy。
MaxBytes + Omit() 示例(限制 attribute 体积;JSON 路径仍会 marshal):
atrace . WithAttributeRule ( atrace . OperationWorkflow , atrace . AttributeKey ( "gen_ai.workflow.request" ),
atrace . MaxBytes ( 16 << 10 ), atrace . Omit (),
)
Truncate 示例(接受完整 marshal,仅限制导出体积):
atrace . WithAttributeRule ( atrace . OperationWorkflow , atrace . AttributeKey ( "gen_ai.workflow.response" ), atrace . Truncate ( 64 << 10 ))
兼容性说明
启用 Drop/Omit/Truncate 后,部分监控后端可能无法从 attribute 还原结构化全文;请按当前后端实际读取的 key 与内存预算 opt-in 评估。
chat/generation span 上,Langfuse exporter 读取顺序:*.otel → legacy gen_ai.*.messages → trpc.go.agent.llm_request / llm_response。InvokeAgent 只从 *.otel 回退到 legacy messages。适用来源都缺失时 Input/Output 可能为空。
Jaeger / 通用 OTLP 通常展示原始 key。官方 GenAI 字段是 gen_ai.input.messages;*.otel 是框架扩展。
同时 fan-out 到 Langfuse 和 Jaeger 时,任何一端还要用的字段都不能 Drop。
进阶功能
自定义 Exporter
如果需要将可观测数据发送到自定义的监控系统:
import (
"go.opentelemetry.io/otel/exporters/otlp/otlptrace/otlptracehttp"
"go.opentelemetry.io/otel/sdk/trace"
)
func setupCustomExporter () error {
exporter , err := otlptracehttp . New (
context . Background (),
otlptracehttp . WithEndpoint ( "https://your-custom-endpoint.com" ),
otlptracehttp . WithHeaders ( map [ string ] string {
"Authorization" : "Bearer your-token" ,
}),
)
if err != nil {
return err
}
tp := trace . NewTracerProvider (
trace . WithBatcher ( exporter ),
)
// 设置为全局 TracerProvider
otel . SetTracerProvider ( tp )
return nil
}
参考资源
通过合理使用可观测功能,你可以建立完善的 Agent 应用监控体系,及时发现和解决问题,持续优化系统性能。
2026-10-08 08:14:18
2025-08-25 07:06:16