Observability Features
Overview
tRPC-Agent-Go provides comprehensive observability features built on the OpenTelemetry standard, offering powerful observability capabilities for Agent applications. With observability enabled, developers can achieve end-to-end monitoring of Agent runtime status, including tracing, performance metrics collection, and logging.
🎯 Key Features
- Tracing: Fully records call chains during Agent execution.
- Metrics: Collects key runtime performance data for Agents.
- Logging: Unified log collection and management.
- Multi-platform Support: Supports mainstream monitoring platforms such as Jaeger, Prometheus, Galileo, and ZhiYan Monitoring Bao.
- Flexible Configuration: Supports multiple configuration methods and custom extensions.
Integration with Different Monitoring Platforms
Langfuse Integration
Langfuse is an observability platform designed for LLM applications and supports collecting tracing data via the OpenTelemetry protocol. tRPC-Agent-Go can export Trace data to Langfuse via OpenTelemetry.
1. Deploy Langfuse
Refer to the Langfuse self-hosting guide for local or cloud deployment. For a quick start, see the Docker Compose deployment guide.
2. Go Code Integration Example
See the complete example at examples/telemetry/langfuse.
Note: LANGFUSE_HOST is passed to OpenTelemetry otlptracehttp.WithEndpoint, so it must not include http:// or https://. The scheme is controlled by LANGFUSE_INSECURE, and the path is fixed to /api/public/otel/v1/traces.
Run the example:
You can view tracing data in the Langfuse console.
For message payload compatibility and the recommended OTel role + parts fields, see Multimodal Telemetry Messages.
Integration Code Description
Langfuse supports receiving Trace data via the /api/public/otel (OTLP) endpoint, supporting HTTP/protobuf only, not gRPC.
The above code integrates with Langfuse by setting OTEL_EXPORTER_OTLP_HEADERS and OTEL_EXPORTER_OTLP_TRACES_ENDPOINT.
AUTH_STRING is the base64 encoding of public_key:secret_key, which can be generated using the following command:
To specify the endpoint for traces only, set:
Jaeger, Prometheus, and Other Open-Source Monitoring Platforms
Refer to code examples in examples/telemetry.
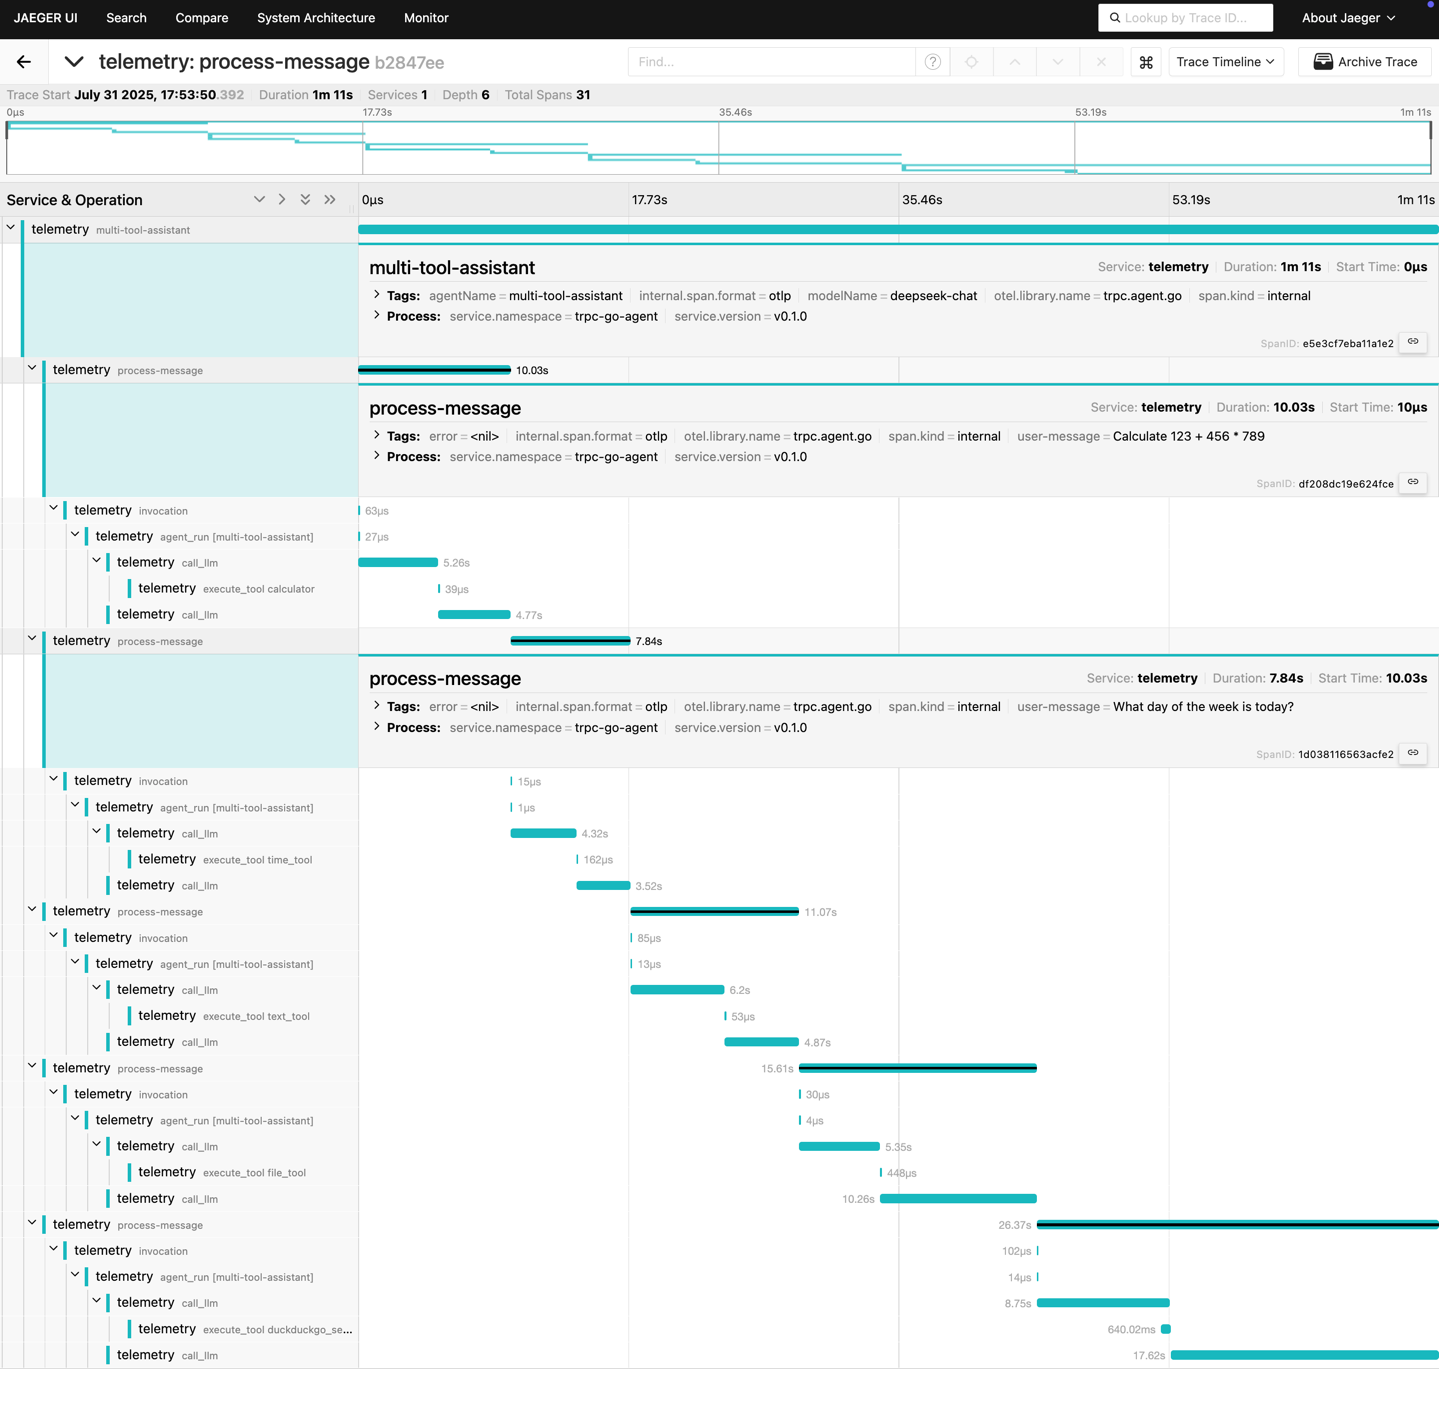
Jaeger trace example
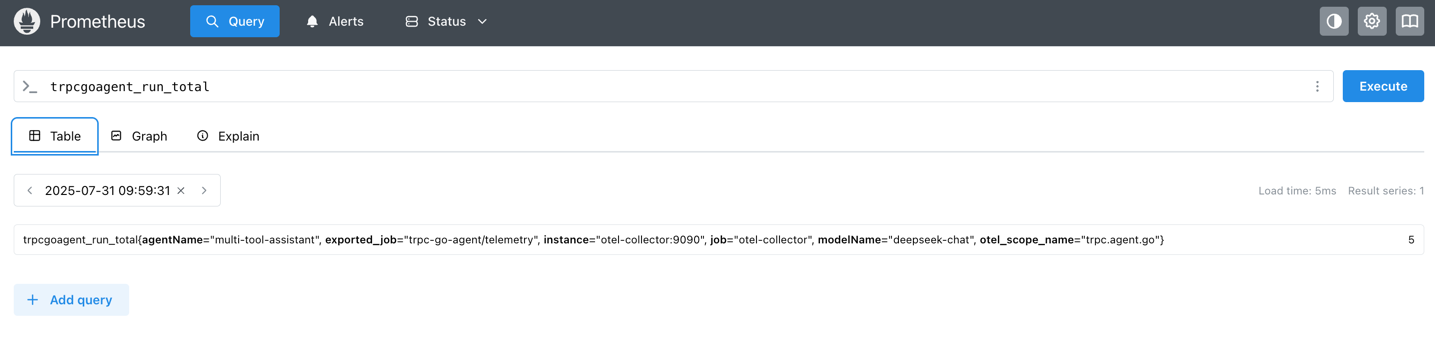
Prometheus metrics example
Practical Application Examples
Basic Metrics and Tracing
Agent Execution Tracing
The framework automatically instruments key components of Agents:
Telemetry Data Analysis
Trace Analysis
A typical Agent execution trace structure:
Trace data can be used to analyze:
- Performance Bottlenecks: Identify the most time-consuming operations.
- Error Localization: Quickly locate the exact failing step.
- Dependencies: Understand relationships between components.
- Concurrency Analysis: Observe the effects of concurrent execution.
For Graph LLM nodes, an error response is recorded on the chat span as well as
in chat metrics. Both use the response after model callbacks to derive
error.type: first choose the response error type as the base label, or _OTHER
when the type is empty, then append _ and the error code if the code is non-empty.
For example, an empty type with code 429 produces _OTHER_429. The chat span
is marked as an error; a parent workflow span may also record the propagated failure.
Final response validation failures are also recorded on the chat span with the
same error.type as chat metrics, including when a model callback supplied a
successful replacement response before validation failed.
Span Attribute Policy (Production Side)
telemetry/trace provides an opt-in SpanAttributePolicy that controls collection and size of large payload span attributes at span creation time.
Default (unset) behavior is unchanged.
Two capabilities
Drop()and unconditionalOmit()(withoutMaxBytes) skipjson.Marshal.MaxBytes()+Omit(): raw[]bytepaths (for exampleexecute_tooltool arguments) compare length without an extra marshal; JSON-backed paths (chat / workflow / invoke_agent) still require a full marshal and do not reduce heap peaks.Truncate()always marshals the full payload; it only limits the value written to the span.
| Rule | Reduces marshal heap peak? | Notes |
|---|---|---|
Drop() |
Yes | Skips marshaling; attribute not written |
Omit() (no MaxBytes) |
Yes | Skips payload marshaling |
MaxBytes(n) + Omit() |
JSON: no; []byte: yes |
JSON paths marshal fully before comparing size; []byte paths use len only |
Truncate(n) |
No | Full marshal, then truncate on export |
To reduce memory, prefer Drop() on attributes this backend will not read. Do not copy another backend's sample blindly: Langfuse and Jaeger / generic OTLP consume different keys.
Coverage
Large payload attributes are wired for chat, invoke_agent, workflow, and execute_tool (messages, llm request/response, workflow request/response, tool arguments/result, and related keys).
Configuration
Jaeger / Galileo / generic OTLP consume raw span attributes. If the UI only uses gen_ai.input.messages / gen_ai.output.messages, Drop *.otel to skip that marshal:
If trace.Start is not used, call atrace.SetSpanAttributePolicy(...) before the first LLM invocation. trace.Start installs the policy only after tracer initialization succeeds; clean() restores the previous policy.
MaxBytes + Omit() example (limits attribute size; JSON paths still marshal):
Truncate example (full marshal, limited export size):
Compatibility
Drop/Omit/Truncate may prevent some backends from reconstructing structured full text from attributes. Opt in based on the keys your backend actually reads and your memory budget.
- On chat/generation spans, the Langfuse exporter reads
*.otelfirst, then legacygen_ai.*.messages, thentrpc.go.agent.llm_request/llm_response. InvokeAgent only falls back from*.otelto legacy messages. If none of the applicable sources are present, Input/Output may be empty. - Jaeger / generic OTLP usually display raw keys. The official GenAI field is
gen_ai.input.messages;*.otelis a framework extension. - When fanning out to Langfuse and Jaeger, do not Drop a family that either backend still needs.
Advanced Features
Custom Exporter
If you need to send observability data to a custom monitoring system:
References
- OpenTelemetry documentation.
- tRPC-Agent-Go telemetry examples.
By using observability features properly, you can establish a complete monitoring system for Agent applications, discover and resolve issues in time, and continuously optimize system performance.